Last week you downloaded OSM data. We are going to use that data for short introduction to network analysis. If you did not download the data, you can work through last week’s tutorial but the dataset is also on the L drive (GEOG204/tutorial7).
Project the data
To perform network analysis, we need to use a projected coordinate system. For BC, we will NAD 83 UTM zone 10N.
- Add the data to QGIS and check the projection.
- On each layer right click > Properties > Source. Note the assigned CRS. This is the coordinate system (map projection) assigned to each data layer.
- On the bottom right hand corner of QGIS window, note the current CRS. This is coordinate system in which the data for your project are displayed.
- Change the projection for the all_lines and poi layers to UTM zone 10N.
- Right click > Export > Save Features as
- Assign a new name: all_lines_UTM and poi_UTM, respectively. In the CRS field specify, EPSG:26910 – NAD 83 / UTM Zone 10N
- At this point your map canvas is still in WGS 84 (see bottom right hand corner in QGIS window). In other words the data for your project are still displayed in WGS84. You can change this by clicking that CRS button or Right click on either all_lines_UTM or poi_UTM >> Layer CRS >> Set Project CRS from layer.
Network Analysis: Service Area
You are going to use Service area analysis to evaluate accessibility from specified location.
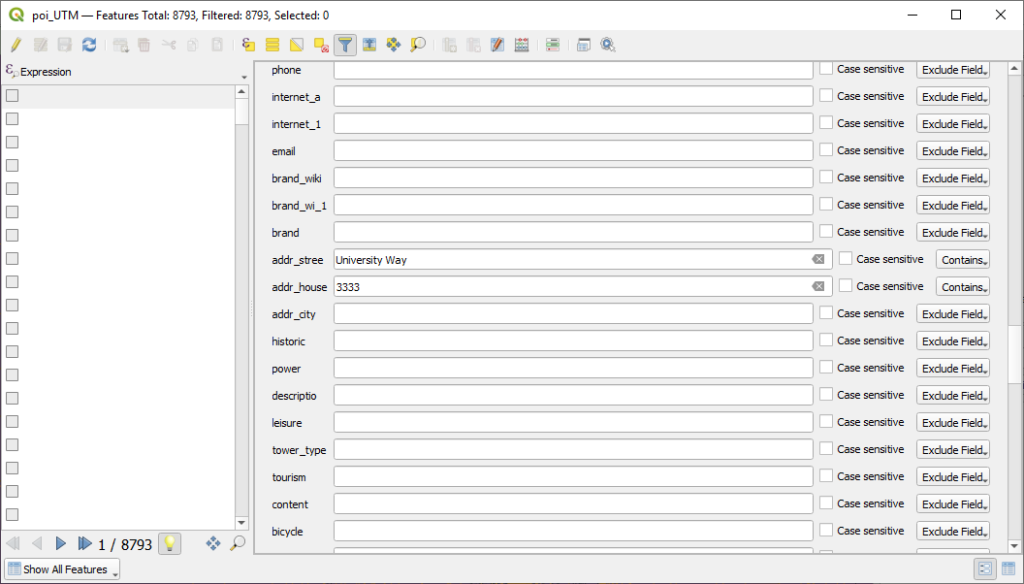
- Open the attribute table for poi_UTM and filter a point with addr_stree: University Way and addr_house: 3333. Click the Select Features button to select it.
- Right click on the poi_UTM layer >> Export >> Selected Features As… Name your layer uni_start
- On the QGIS main menu Processing >> Toolbox. In Processing Toolbox, choose Network Analysis >> Service Area (from layer)
- Vector layer representing network: all_lines_UTM
- Path type to calculate: Fastest
- Vector layer with start points: uni_start
- Travel Cost: 0.25 (this represents 1/4 of an hour)
- Leave the other fields on the default settings and Click Run
- Repeat the steps in the bullet above but this time for 7.5 minutes
- What do your service area layers represent?
- Repeat the steps in the previous bullet with Path type to calculate: Shortest and Travel cost: 2000. 2000 represents 2 kilometers
- Are there any residential buildings within 2 km from the University? Hint: refer to the OSM layer.
- Now can you try using the Shortest Path algorithm? I would like to see it.