Last week you explored raster classification. This week you will work towards the same end but using vector data.
The data you will use has been placed on the L Drive under GEOG204/tutorial6. Copy that data to your work folder and add the shapefile in that folder to QGIS.
The description for some of the fields in the attribute table:
| Pop16 | Total Population in 2016 |
| Pop15Yrs | The population 15yrs and above |
| PopLabo | Population in the labor force |
| PopLabE | Employed population in the labor force |
| PopLabU | Unemployed population in the labor force |
| PopNotLab | Population not in the labor force |
| POP_DSTY | Population density |
| LabPRate | Labor participation rate |
| UnEmpRate | Unemployment rate |
You are going to find the dissemination areas where the Labor participation rate is low and the unemployment rate is high.
- From the main menu, go to Edit >> Select >> Select by Value
- In the window that opens up, set UnEmpRate: Greater than (>) 0.07; and set LabPRate: Less than (<) 0.6. Then choose Select Features and close the window.
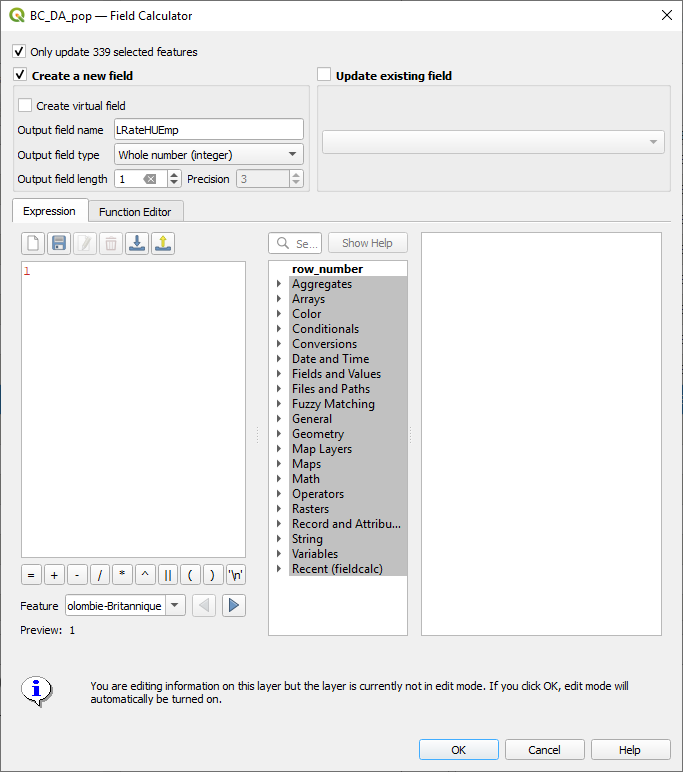
- Next open the Attribute Table and open the Field Calculator. Add a new field LRateHUEmp, field type Integer, and only update the selected features with a value of 1
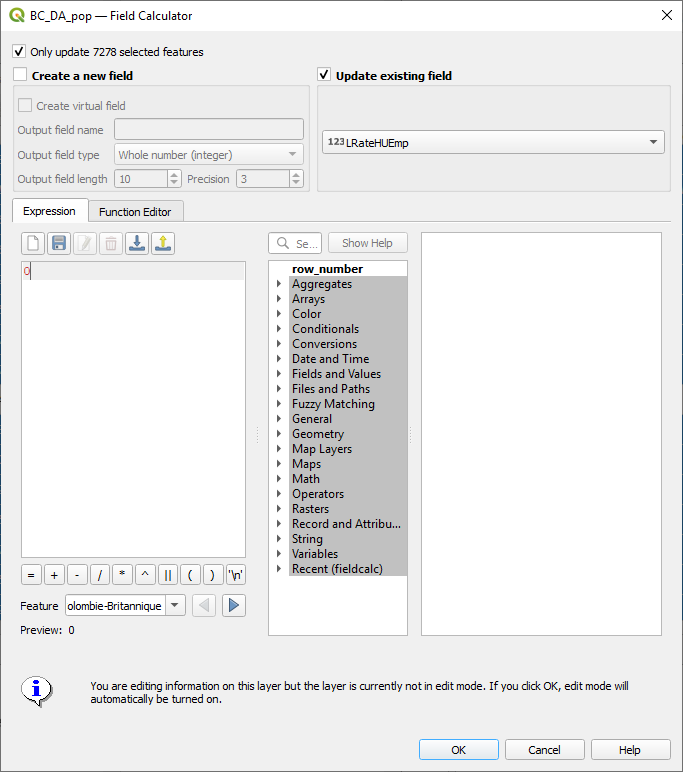
- On the attribute table, click the Invert Selection button and then open the field calculator again and update the LRateHUEmp field for selected features as shown below. Toggle the editing mode and save your edits.
- Next export your shapefile to a raster layer representing LRateHUEmp.
- Raster >> Rasterize (Vector to Raster)
- burn-in value field LRateHUEmp
- Output raster size units: georeferenced, 100 width, 100 height
- output extent: calculate from layer
- Output data type: Byte
- Rasterized: choose the location and name of your output file
- Raster >> Rasterize (Vector to Raster)
- Next export your shapefile to a raster layer representing Population density
- Raster >> Rasterize (Vector to Raster)burn-in value field POP_DSTY
- Output raster size units: georeferenced, 100 width, 100 height
- output extent: calculate from layer
- Output data type: Float32
- Rasterized: choose the location and name of your output file
- Next you are going to multiply the two raster layers you just exported.
- Raster >> Raster Calculator
- What does the output layer represent?
- The population density in BC is about 4.5. and if you look at the histogram (Properties >> Histogram) most of the values are low. From here you can also tell there are outliers.
- Go to Properties >> Symbology and try to represent the output with a different color band and diffreent Min and Max Values.
- What does it all mean?
- Raster >> Raster Calculator