The Video Link for this Tutorial is:
Video Link
GNSS refresher
Take a look at the Geog 204 tutorial on GNSS to get a refresher on how GNSS works. GNSS stands for Global Navigation Satellite System.
GDAL and creating a list of raster layers
I (Scott) realize windows is getting better, but man – Linux just works better for so many things. As we cannot access the L: drive on the Linux machines of yet, we created a tile index for the orthophotos for Prince George using windows command line. It worked of course, but slow. The command is:
gdaltindex -f “GPKG” pg_2108_orthos.gpkg L:\DATA\pg_lidar_ortho_2018\2018_Tiff*.tif
Have to love GDAL
We are Using Osmotar today
We will be working on osmotar for most of the tutorial today – that is where the data is.
Base Map Layer for your project
Orthophotos
Open up QGIS and a browser on osmotar
Grab the pg_2108_orthos.gpkg file from the L:\GEGO413\geopaparazzi_smash\ folder on osmotar and open it in QGIS. Pick an area of interest (tile) from the dataset and then copy the matching ortho file to your K: drive.
The tif files are located in:
L:\DATA\pg_lidar_ortho_2018\2018_Tiff
Roads from the City of PG
Go to the open data site from the City of Prince George and get the road centerlines (https://data-cityofpg.opendata.arcgis.com/datasets/road-centerline). Load them into your project and style them accordingly.
Webtile background
Add the OSM Standard map to the page and zoom into the ortho photo.
Create a map tile for the area
It seems to work better to change the projection of your canvas to be one that is used for a global projection. The data from the city is in UTM Zone 10 North NAD 83 (26910), but your map should be in either unprojected (4326) or Web Mercator (3857).
SET YOUR PROJECTION to 3857
in the bottom right of the QGIS window change you projection to 3857
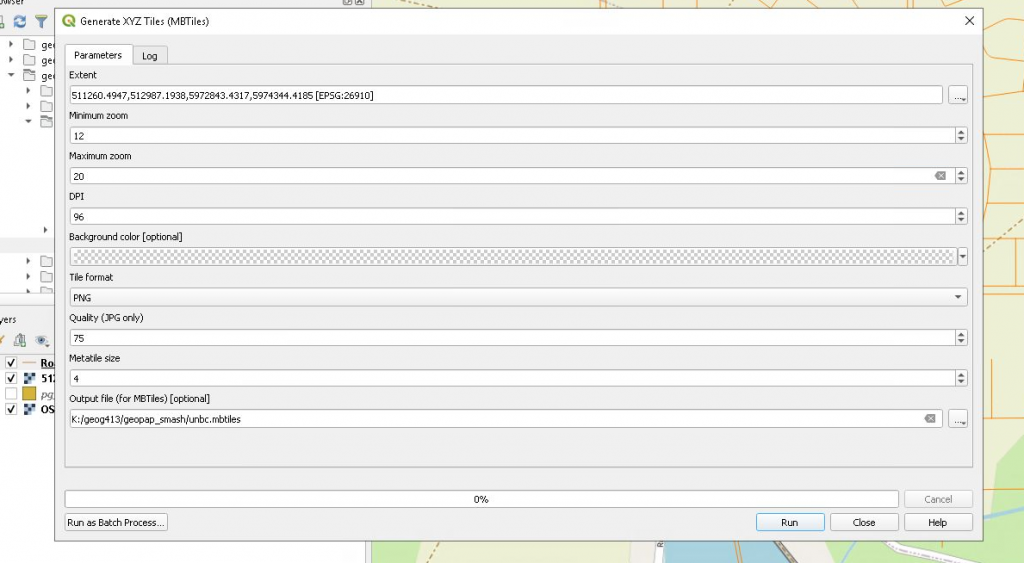
Once you have your map set up, open up the geoprocessing toolbox. Launch the Generate XYZ Tiles tool.
Create a web tile set
Set it up similar to the following inputs (zoom in and use the canvas extent):
Create some vector data to add to your mobile phone
While the tiles are being generated:
- open a second QGIS instance
- Open the OSM Standard map tile (QuickMap)
- Install the plugin “Quick OSM“
- Zoom in close to an area of interest (i.e. center on PG at 1:75000)
- Launch the Quick OSM plugin (vector –> Quick OSM)
- Under the Quick Tab of the plugin (first tab) set the query to be the canvas extent
- Run the query
You should get a bunch of data of the area. Save the layers each as a geopackage with appropriate naming.
Creating Forms
This will be for the Lecture on Wednesday, but you can get a start if you wish. Forms are written in JSON. Don’t be intimidated by this – it is much easier than programming with Python. SMASH is still not as heavily developed as Geopaparazzi, so it appears as though there is only one file the app makes use of – tags.json.
If you wish, you can follow the SMASH documentation – that actually leads to the geopaparazzi docs – to play around with forms. Remember, always save a good working version of the tags.json file.
Assignment and next steps
The assignment for field collection will include
- Orthophotoscreating input layers for SMASH from this tutorial
- form building from the lecture this week
- working with RTK data from the lab this week
- data collection
- downloading the data collected
- organizing these data into PostGIS.
This assignment will be worth 20% and the details of this assignment will be finalized by Thursday’s lab.