In the last tutorial, you created a shapefile with a name BCDAPop. You are going to use this shapefile to convert data from vector to raster. We will achieve this using the census data to calculate the labor participation rate and the unemployment rate. This is a superficial analysis, designed to explore GIS tools.
You will create the labor participation rate and the unemployment rate as two separate fields in the shapefile. You will then create raster files for the population density, the labor participation rate and the unemployment rate. Following this you will some reclassification and raster algebra to see the population density in places with low labor participation rates and high unemployment rates.
Open QGIS and load your project. You are going to work on the BCDAPop shapefile.
- Create the labor participation rate
- In the field calculator create a new field called LabPRate.
- Output Field type: Decimal number
- In the expression Field
- Divide the field with Population in labor force by the field with population 15yrs and over
- Save your edits
- Create unemployment rate
- In the field calculator create a new field called LabURate.
- Output Field type: Decimal number
- In the expression Field
- Divide the field with the population in the labor force but unemployed by the field with population 15yrs and over
- Save your edits
- Create Raster files
- In QGIS on the Main menu choose Raster >> Conversion
- Click on Rasterize (Vector to Raster)
- Field to use for burn-in value: the field with the population density
- Output raster size units : Georeferenced Units
- Width/Horizontal Resolution: 100
- Height/Vertical Resolution: 100
- Output Extent: From the drop down option choose Calculate from Layer
- Output data type: Float32
- Rasterized: assign a name and location for your raster file
- this is the file that shows the population density
- Repeat the above steps for LabURate field and the LabPRate field
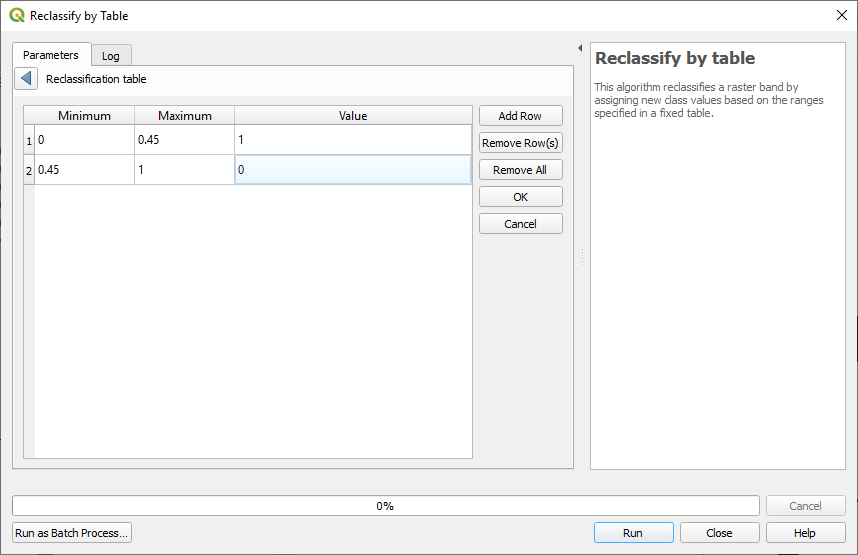
- Reclassify
- In QGIS on the Main menu choose Processing >> Toolbox
- In the toolbox window that opens up search for reclass and choose Raster Analysis >> Reclassify by table
- In the window specify your raster showing the labor participation rate
- The labor participation rate in Canada is about 65%. We will broadly assume that anything less that 60% is low. Design your reclass table as shown below.
- Range Boundaries: min<value<=max
- Specify the name of your raster layer as labor_rate_binary
Next explore the range of values in your raster layer with the unemployment rate. If it is greater than the assumed 7%, reclass those as 1.
- Using the Raster Calculator
- On the main menu go to Raster >> Raster Calculator
- Multiply the labor_rate_binary by the layer with unemployment rates. Name the new layer LaborR_and_UnempR