Housekeeping
Before we get started today, double check that your active portal (the web link near your user ID in the top-right corner of ArcGIS Pro) is set to https://unbc.maps.arcgis.com/. If it isn’t, find instructions for changing your active portal here: https://gis.unbc.ca/support/arcgis-pro-portals/
Summary
The purpose of today’s lab is to gain an understanding of map and coordinate systems. We will be working with several layers today, and they might not have the best appearance at this stage of the course we will be addressing how to stylize layers as the semester continues. For today focus on how to locate data, what map scales mean, and how coordinate systems work.
Assignment 2:
Note that this lab includes 5 questions worth 5%. These are identified by number (1-5). We encourage you to start a Word (or other word processing) document with a title for your assignment that includes the course number, lab section (Wednesday = L3, Thursday = L2, and Friday = L1), and your name, and write your answers to the questions you’ll find throughout this lab. Save the file as <username>_GEOG205_Lab2, and submit as a .docx file for Assignment 2 in Moodle.
Canadian National Topographic System (NTS)
NTS Backgrounder
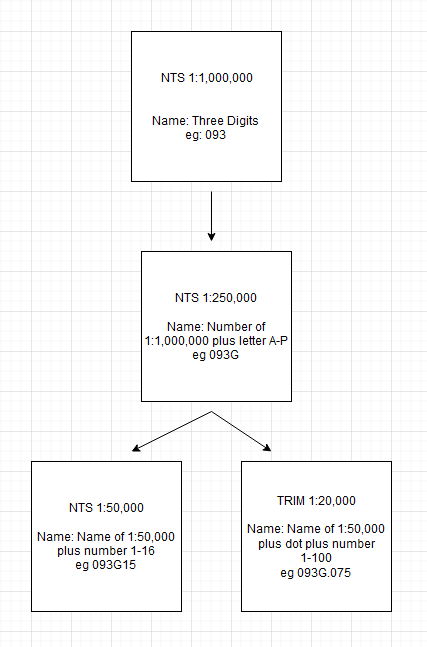
Canada’s national topographic map series (NTS) uses scales 1:1,000,000, 1:250,000, and 1:50,000.
In this section, you will explore the map numbering conventions for the National Topographic System 1:50,000 and 1:250,000 maps, and how their numbering convention is based on the 1:1,000,000 map series shown in lecture.
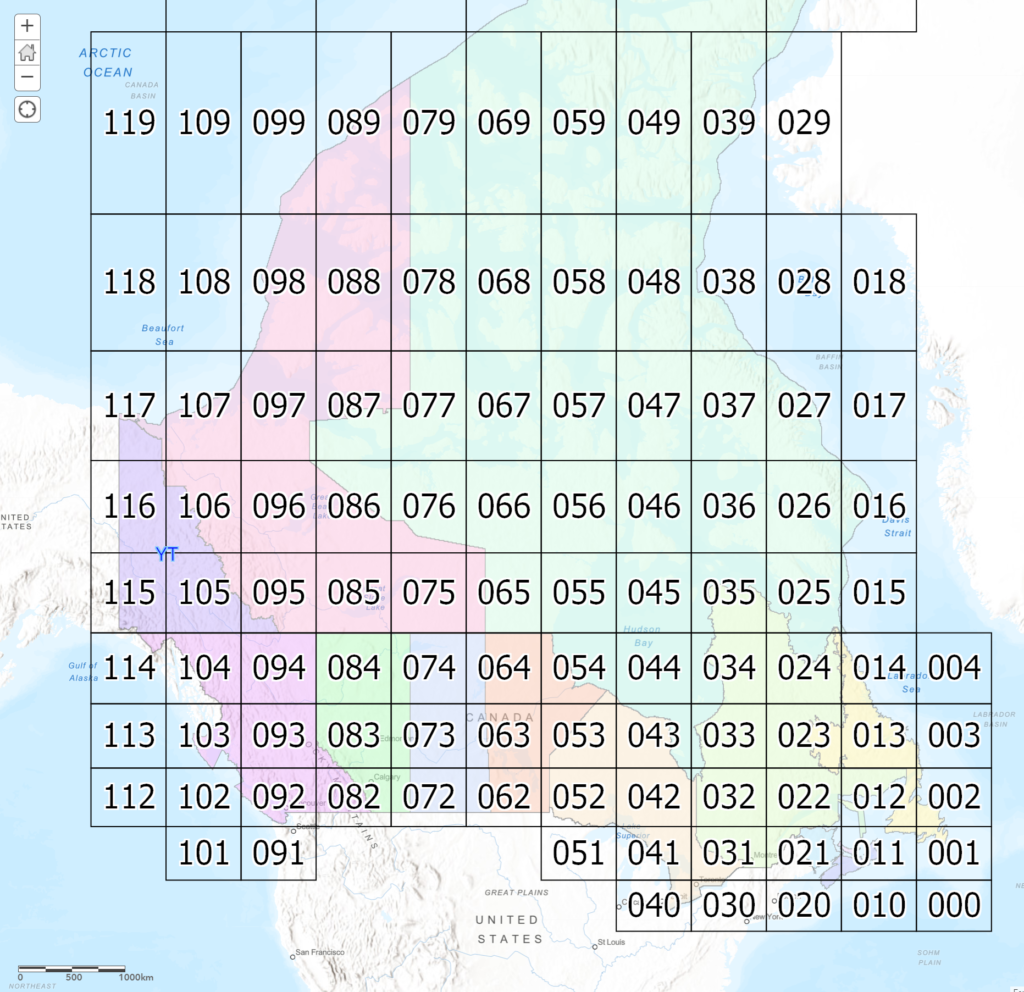
To understand the National Topographic System, begin by imagining Canada divided into a grid that is 8 degrees of Longitude wide by 4 degrees of Latitude tall. The grid sheets are numbered from bottom to top, and east to west.
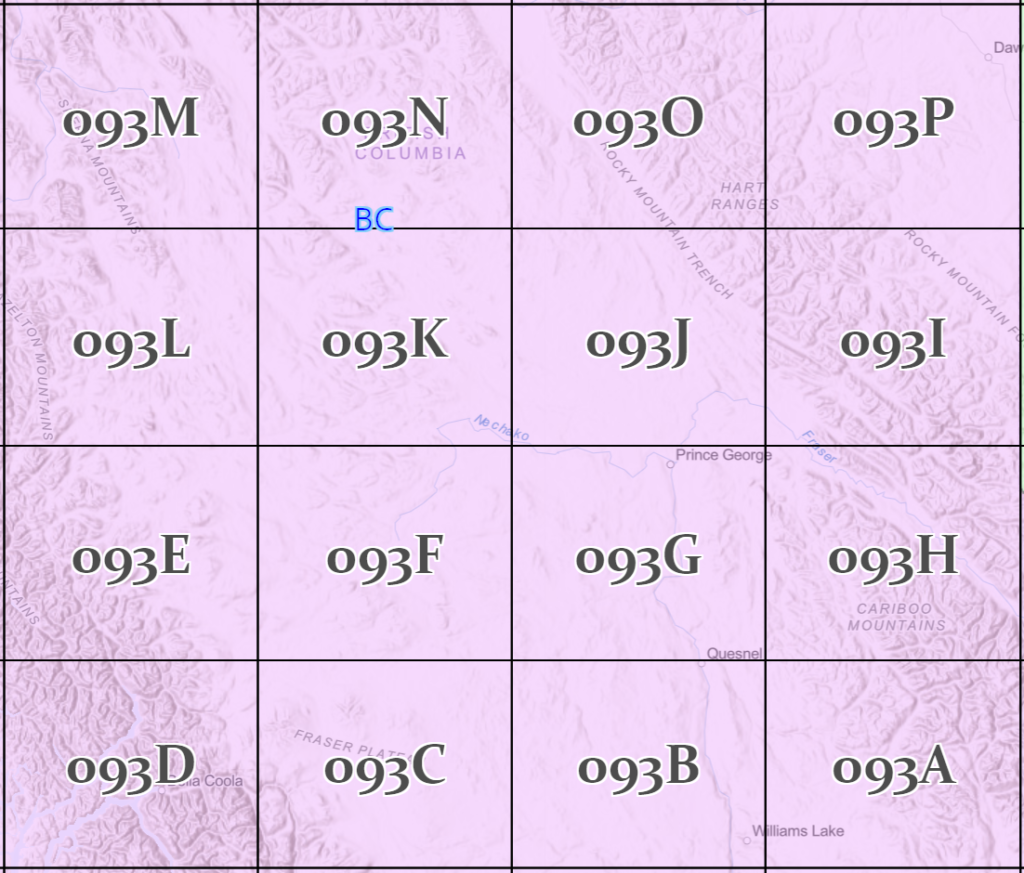
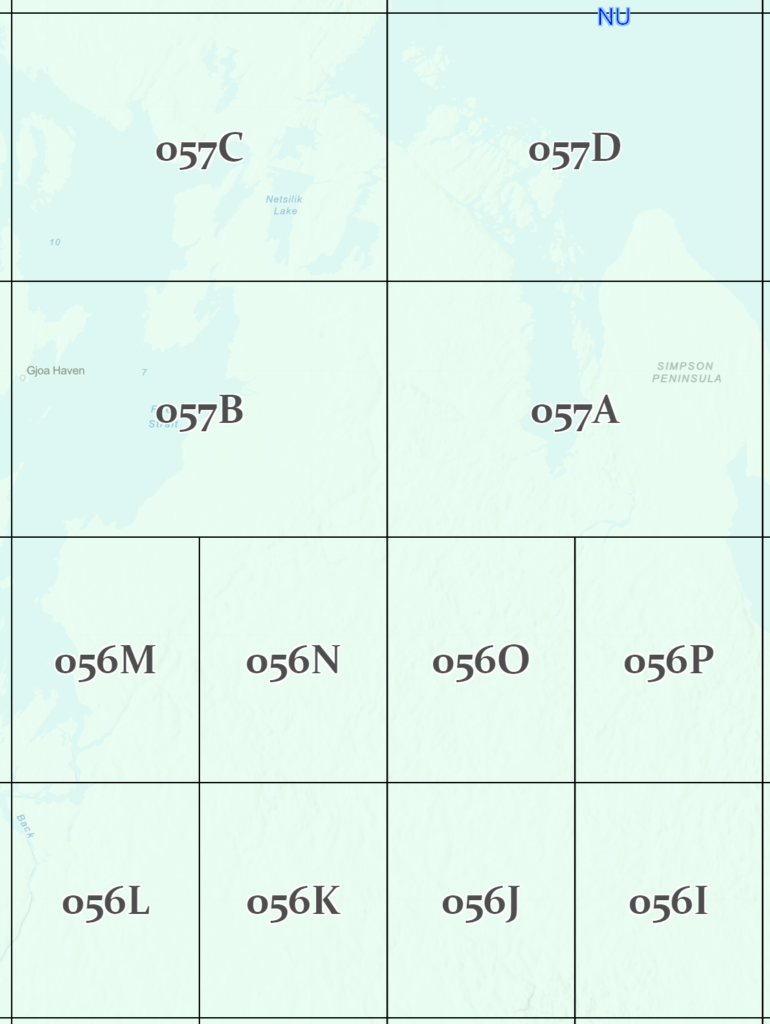
Each NTS map sheet is a 8 x 4 degree region that is further divided into a 2 x 1 degree grid. Each 1:250,000 scale map sheet is given a letter of the alphabet from A to P. These letters are appended to the 8 x 4 degree grid number to create the 1:250,000 scale map sheet number. Prince George is located on 093G. Note how the letter designations start lower-right corner and wind back and forth up the grid, ending upper-right.
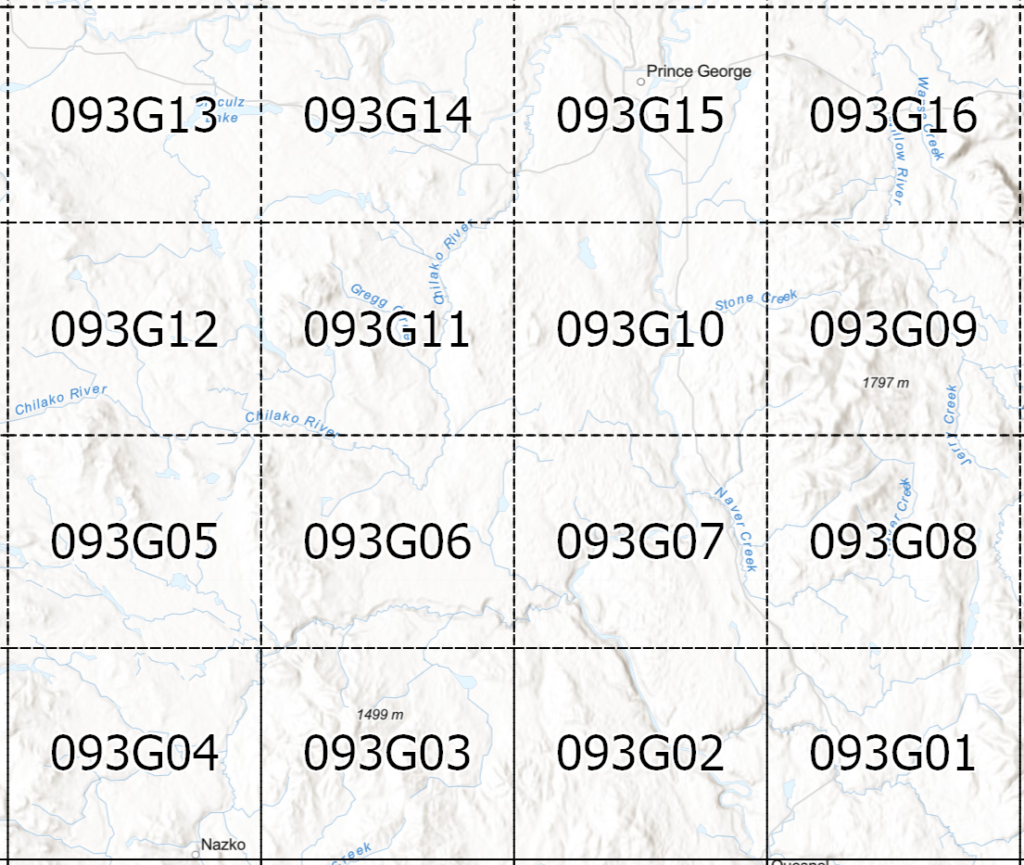
Each NTS 1:250,000 sheet is further subdivided into a ½ degree x ¼ degree grid (30 minutes Longitude x 15 minutes Latitude). These 1:50,000 map sheets are numbered 1 to 16 and these numbers are appended to the 1:250,000 map sheet number. Prince George is on map sheet 093G15.
You have just seen Canada’s National Topographic System (NTS) for south of 68N. The 1:250,000 NTS grid is 2 x 1 degrees and the 1:50,000 NTS grid is 30’ x 15’.
Further north:
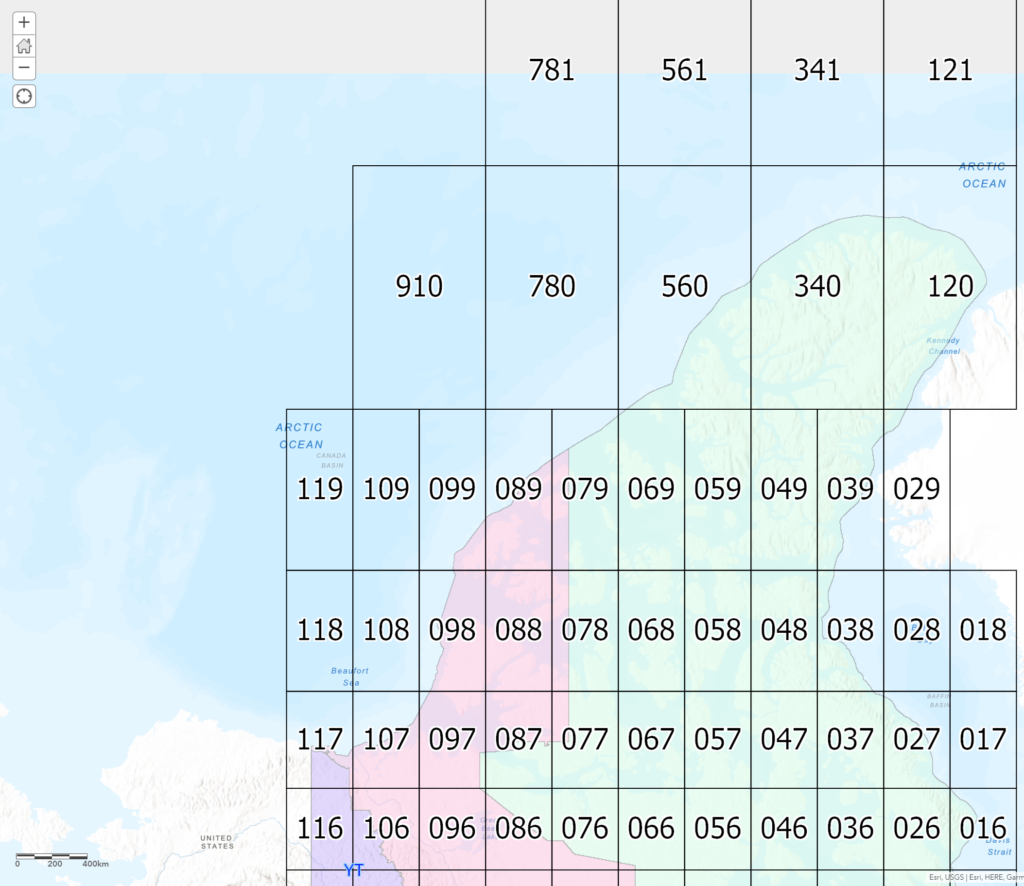
This far north note how narrow the widths of the map sheets have become compared to the lengths (height). The northern parallel of latitude of sheet 56 is 68 North.
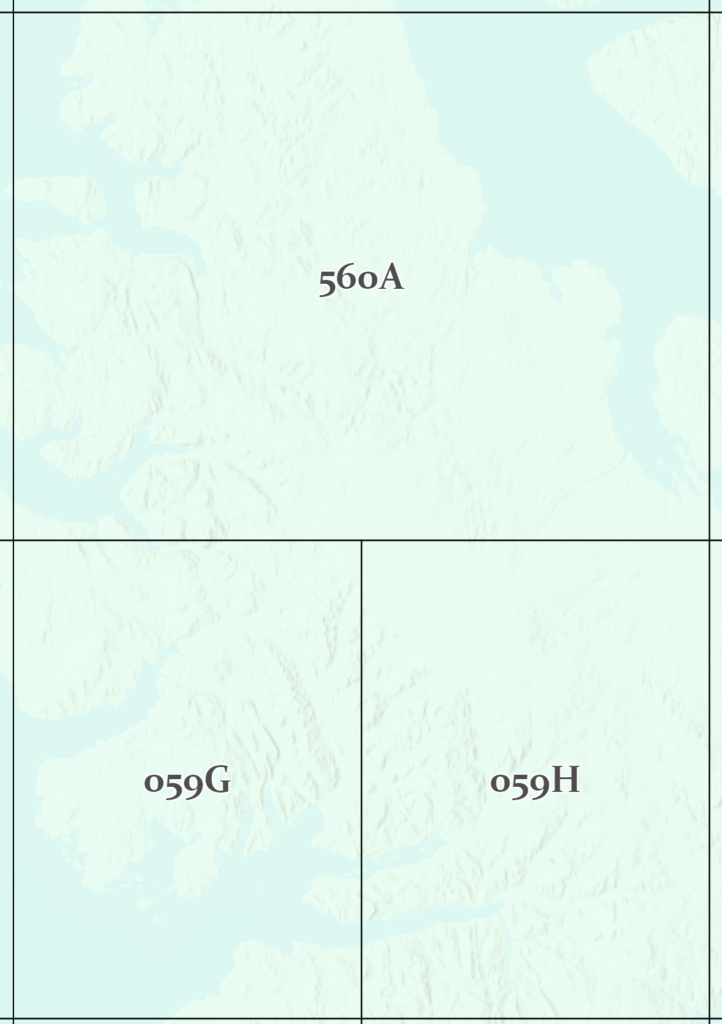
The northern parallel of grid sheet 59 is 80 North Latitude. North of 80, the width of the 1:250,000 map sheets doubles, to 2 degrees of Longitude. The primary grid (1:1,000,000) also doubles in width creating a 16 Longitude x 4 degree Latitude grid.
Interactive map: Interactive NTS Map
Detailed information on the topographic series at:
NTS Map sheets for BC
Now, you will examine Canada’s NTS map sheets for BC in ArcGIS Pro
- Create a new project in ArcGIS Pro for Lab2 inside your GEOG205 folder on your K: drive.
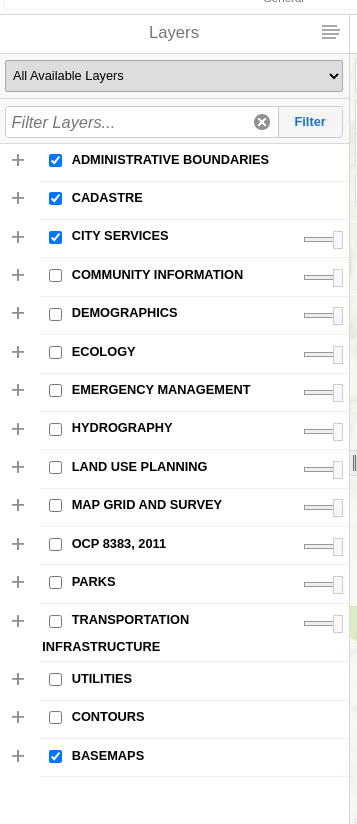
- Open My organization’s content in the Portal Catalog, and add the following layers BC Rivers, BC Lakes, BC Highways, Populated Places, BC Cities, and BC Boundary.
To draw the grid over the map we first need to add some more data to our project. In the Catalog, move over to the Project tab, and right-click on Folders and add new add L:\DATA
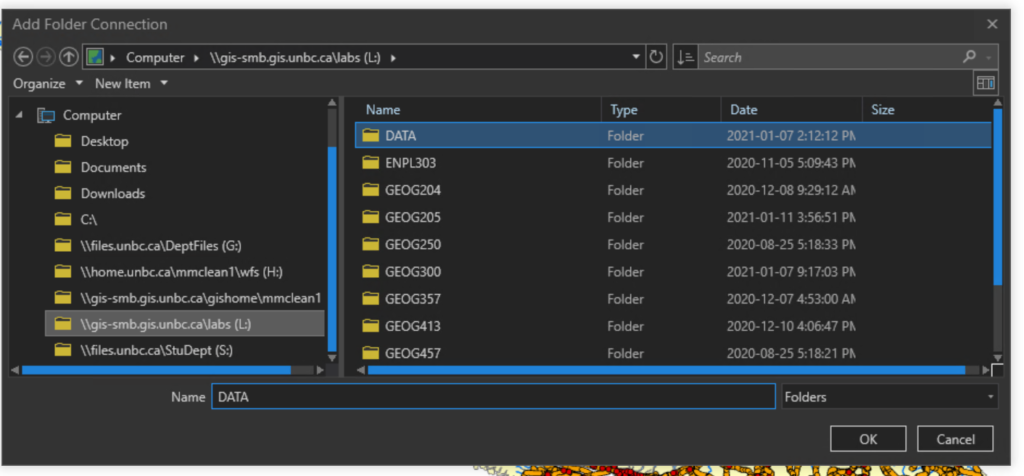
Now you should be able to expand into the nts_snrc folder and add the shapefiles for nts_snrc_1m, nts_snrc_250k and nts_snrc_50k.
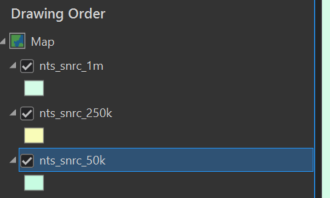
In the table of contents arrange the layers so that 1:1 000 000 is the top layer followed by 1:250 000 and 1:50 000.
The only datasets we have imported into our project so far are shapefiles containing vector data. Notice that we have three different kinds of geometries: some of these shapefiles contain polygons, others contain lines, and others contain points.
Let’s change the symbology of each of the NTS layers so they are displayed only with outlines (rather than filled shapes) and we can see what is going on behind them. Click on the coloured box below each NTS layer name to open the Symbology panel, select Black Outline (1 pt) or Black Outline (2 pt), then switch over to Properties in the Symbology panel and change the Outline Colour to whatever you like. Repeat for the other two NTS layers.
Disable nts_snrc_1m and nts_snrc_250k by pressing the check mark next to each layer. Then select nts_snrc_50k so the layer name is highlighted in blue.
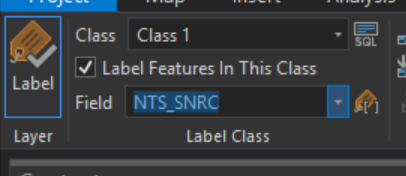
On the ribbon menu, select Labeling. Turn on labels by clicking the tag icon on the far left, then set Field to NTS_SNRC.
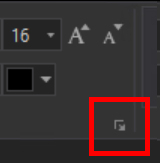
To make the labels readable, set the font to a Sans-Serif (e.g., Arial), Size 16pt.
To find additional text settings, select the tiny arrow button in the bottom-right corner of the Text Symbol box:
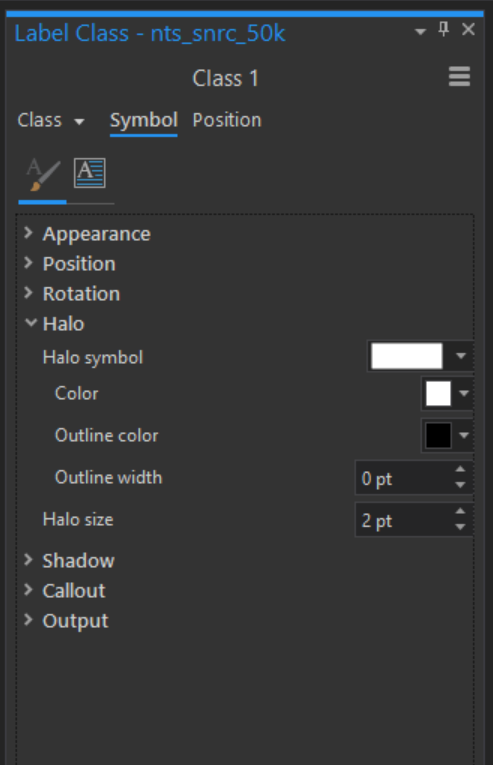
From here, we can add a Halo to the text:
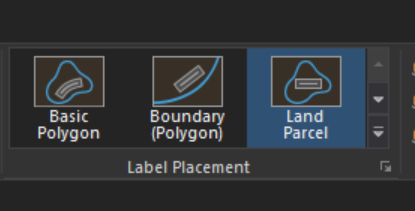
Going back to the ribbon, in the Label Placement block, select “Land Parcel” so that the labels always show inside of the feature that they belong to.
We can now use this map to locate the tiles we will be using.
In a future lab we will be doing a deeper look into the advanced symbology / labeling tools that will allow us to combine all three of these layers, much like the interactive map seen above.
British Columbia TRIM
BC provincial data are produced at a 1:20,000 scale. The map sheets for TRIM (Terrain Resource Information Management) are also based on the 1:250,000 map grid. Each sheet of the entire 2 x 1 degree grid that covers British Columbia is divided into 12 minutes of Longitude x 6 minutes of Latitude grid. This creates 100 TRIM map sheets per 1:250,000 map sheet.
The TRIM sheets are numbered from 1 to 100. These numbers are appended to the 1:250,000 sheet name. British Columbia is covered by 7,027 1:20,000 TRIM map sheets.
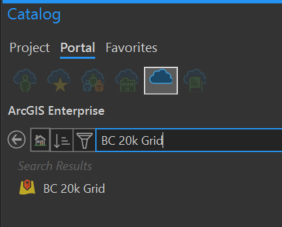
In ArcGIS Pro, add the layer “BC 20k Grid”, from the portal.
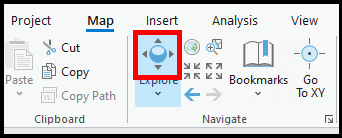
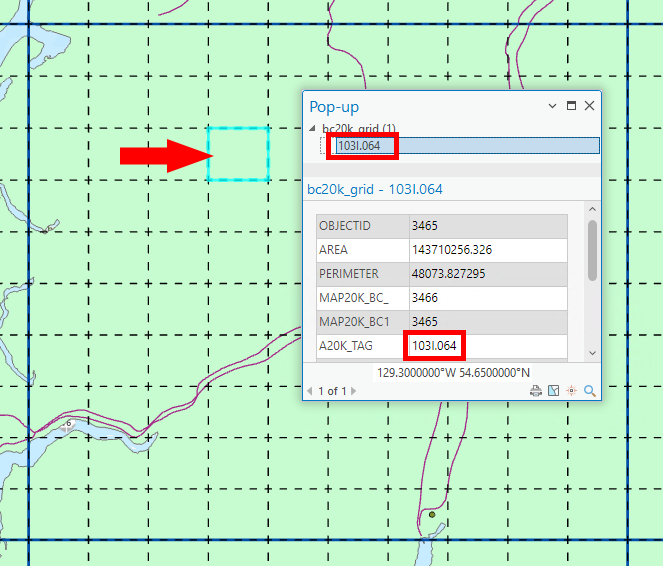
Examine the 1:20,000 map name system and explore the map. Get to know the naming system either by labeling this layer in the same way as we did for the 1:50,000 layer (setting ‘A20K_TAG’ as the field to label by), or by going to Map > Explore and clicking the button with a sphere bounded by four arrows, then clicking on the tile you want to know more about.
Toggle the BC 20k Grid on and off to see the division of each 1:250,000 map sheet into 100 TRIM sheets. Compare this with the 1:50,000 map divisions.
What is the number of the TRIM map sheet immediately above 093G.025?
Other Provincial Topographic Data Sets: Alberta Map Names
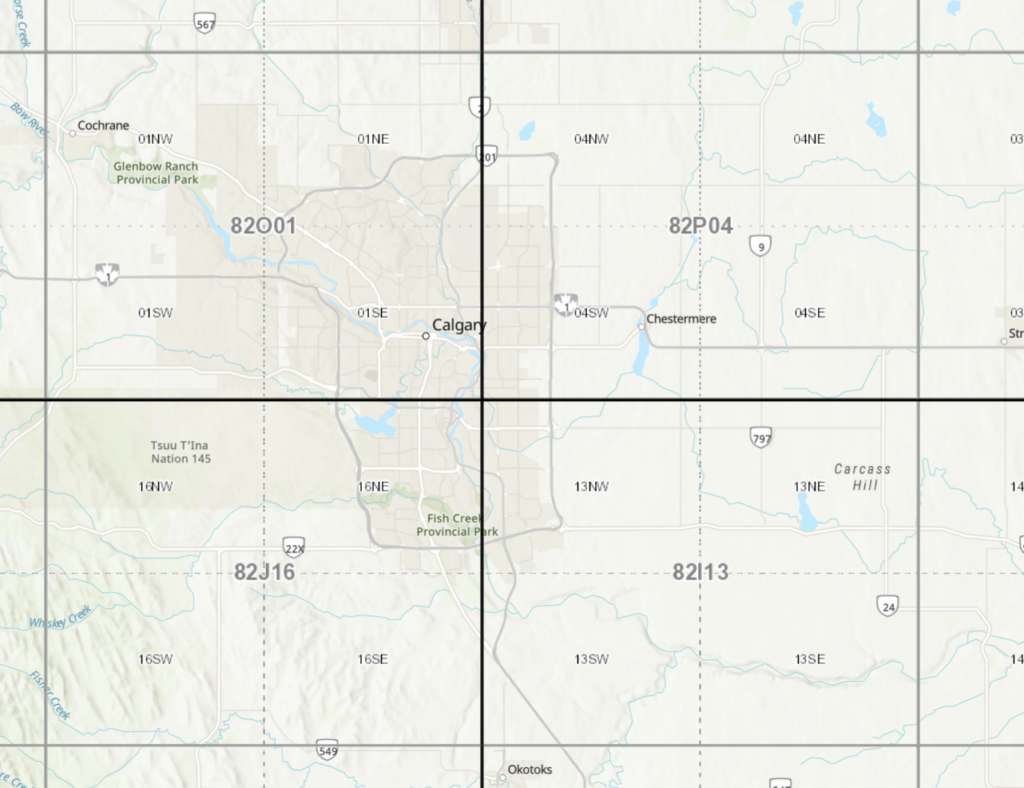
The map sheet grid for Alberta provincial topographic digital data is also at 1:20,000 scale and is based on the 1:50,000 30′ by 15′ map sheet grid. Each 1:50,000 map sheet is divided into Northeast, Northwest, Southeast and Southwest quadrants. For example, if you wanted a 1:20,000 map sheet covering most of downtown Calgary; you would go to NTS tile 82O then select the Alberta tile 01SE.
Map Name Conventions and Scale – Don’t Let the Name Fool You:
At what scale would the data for grid map 093G7 be produced? If we scroll back to the flow chart showing the different map scale naming conventions, we can see that 093G7 doesn’t follow any of the naming conventions we have seen so far for NTS or BC TRIM. Because 093G7 doesn’t match the naming structures we’ve seen (‘3-digit, 1 letter, 2-digit‘ for 1:50,000 NTS data OR ‘3-digit, 1 letter,(period) 3-digit’ for 1:20,000 TRIM data) there is no way of knowing what data set or scale of data is referenced. If the naming conventions were correctly written, then 093G07 would refer to 1:50,000 NTS data, and 093G007 would refer to BC TRIM 1:20,000 data. Note the two digits for the sixteen 1:50,000 sheets, and the three digits for the 100 TRIM sheets. TRIM map sheet numbers are also written as 093G.007 using a period before the sheet number.
To add to the mix: You may still find 1:50,000 scale paper maps from the NTS system in east and west sheets. For example, 093G16E and 093G16W were printed at a time when they split the 1:50,000 sheets into E and W halves. If you find a map sheet like this, it is likely well out of date and if you are looking for up-to-date data, you’d be better off finding a different sheet.
Comparison of image with 1:50,000 map vectors
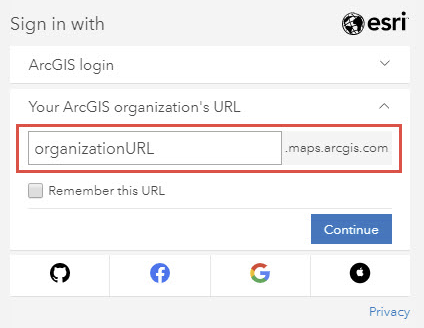
Turn off all layers except for the default World Topographic Map and World Hillshade, then add the image “ikonos_02” from the portal. If it prompts you with a login page asking for your organization’s URL, type “unbc”, select ‘Remember this URL’, and continue – this should resolve the pop-up and allow the data to load.
Right-click ikonos_02 and select Zoom to Layer.
Examine the image. Note the detail. A display scale between 1:10,000 and 1:30,000 is appropriate for this step. Pan around the image and note the detail of the area (4 metre pixels). This (satellite) image was captured in 2002.
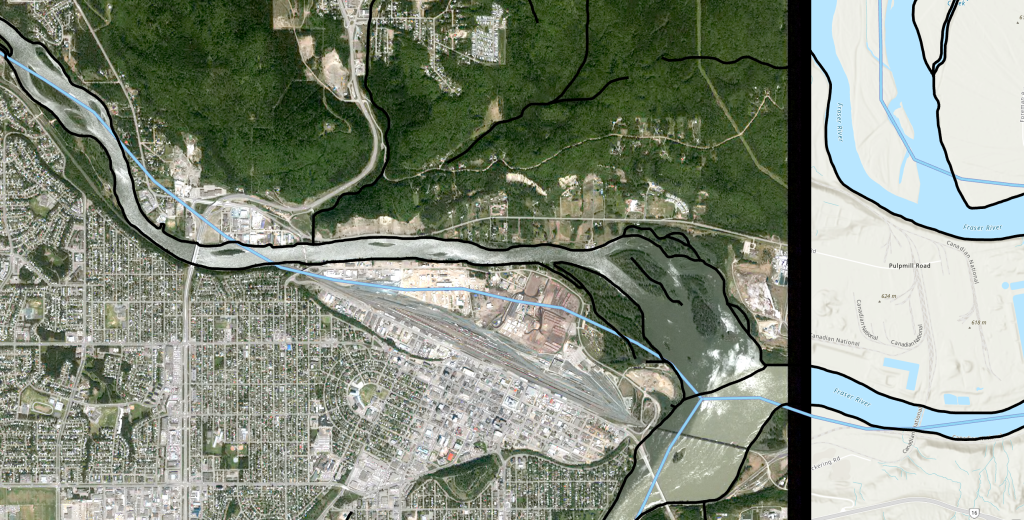
Turn on layers one at a time to note the simplification of the vector layers compared to the features on the raster image.
- Add rivers_093G as 1:50,000 vectors
- Add bcrivers as 1:250,000 vectors
Examine the level of simplification between BC Rivers, and rivers_093G. Turn on the NTS 250k layer, and zoom out until you can see the entire 093G tile. Switch between the rivers_093G and bcrivers layers. Which has a more appropriate level of detail at this scale? Now zoom in on one of the sixteen 1:50,000 tiles or one of the hundred 1:20,000 tiles, and try the two rivers layers again. Is the same layer still the most appropriate river layer?
Paper Map Digital Scans
Add NTS_093G from the portal
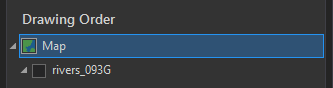
Turn off all the other layers so only the new map is visible. At this point you may notice that the map is stretched out. This is due to this map being in a different projection from our map view. We will talk more about projections later in the course, but for now, double click ‘Map’ at the top of the drawing order:
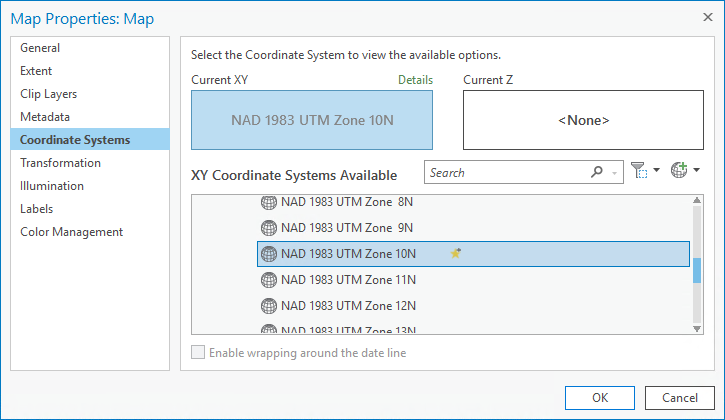
Then go to Coordinate Systems, and look for the available Coordinate Systems. Expand the following folders: Projected Coordinate System / UTM / North America / NAD 1983, then select NAD 1983 UTM Zone 10N.
Select it, press OK, and this will set our map view to the proper projection.
You are examining a digital scan of the paper map.
Zoom In and Pan around. Note the coordinate readout changes as you move the mouse. A digital scan of a paper map can be georeferenced, but this is not always true.
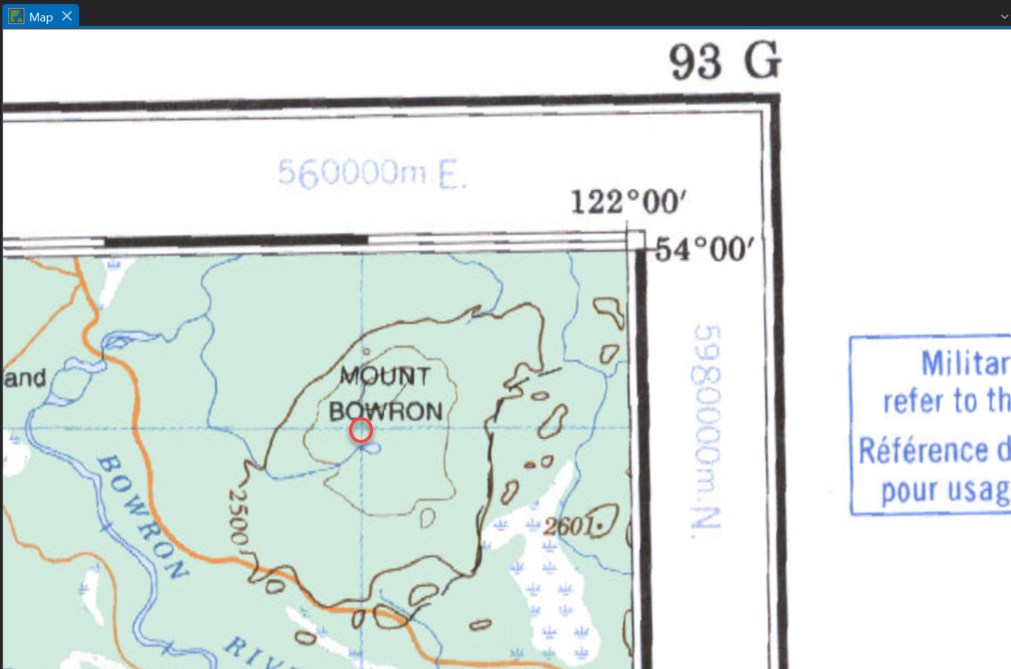
Note the markings at the edge of this 1:250,000 map sheet. The Graticule around the map is labelled with Longitude and Latitude values, illustrated with black and white bars (circled in the illustration below). At this scale, these bars represent 5 minutes.
Note the pale blue grid lines at four centimetre intervals across the paper map. This is the measured grid. At a scale of 1:250,000, four centimetres represents 10,000 metres (10 km) in the real world. Near the four map corners of the map are label values. In the example below, the intersection of the blue lines is marked by the red dot. The x,y coordinate for this dot is: 560000, 5980000 as shown by the blue labels. These values are in metres. X values, known as Eastings, increase from left to right (increase in the easterly direction). Y values, known as Northings, increase from the bottom to the top of the map (increase in a northerly direction).
The notes above also apply to other scales of paper maps, except that the Graticule and measured grid intervals would change with scale. For example, the Graticule interval for 1:50,000 NTS paper map sheets is one minute, and the UTM grid interval is 1,000 metres.
The paper distance across a blue measured grid square is 2 cm. On a 1:50,000 scale map, 500 metres is represented by one cm, or half the width of the blue measured grid square. One hundred metres are represented by 2 mm on a ruler.
Reading UTM values from printed maps
The South tip of Tabor Lake (east portion of map) has these UTM Coordinates: 529350E, 5972750N, 10N
Longitude / Latitude (LL) : 122 degrees 33′ 12″ W, 53 degrees 54′ 8″ N
To get a more up to date and detailed map of Prince George, go into the Portal in the Catalog pane and add 093G087_tif.
Question 1
What are the UTM and LL (Lat/Long in ‘DMS’ format) coordinates for the junction of the entrance road into UNBC from University Way? Exclude decimals in both.
Question 2
What are the same values for the ambulance station at the Prince George airport?
Digital Coordinate Readout
Zoom In on a corner of the NTS_093G map so that you can see the coordinates, and notice that the coordinate readings for the map cursor (nearly) match these labels.
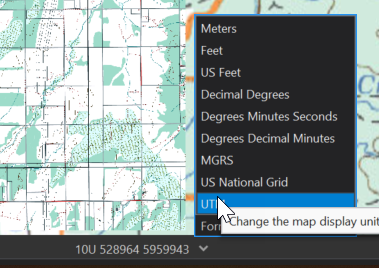
There is a 2nd set of coordinates in blue – these are the UTM labels. By pressing the arrow beside the coordinate readout at the bottom of the screen, we can change into UTM.
- Hold your mouse over the intersection of the blue measured grid lines. The digital coordinate read-out should match these values.
You can turn the whole image on and off. As a raster layer, there are no individual layers for the different data displayed on this map (e.g. you cannot turn off roads in this raster scan of a paper map).
The Identify Tools
In ArcGIS Pro, the Identify tools are found in the Map Ribbon and Active when “Explore” is selected. You will also notice a drop down that alters the behavior of what is identified. The default is Selected in Contents, allowing you to highlight a layer to get information even if it is obstructed by an above layer. Another common choice is Topmost Layer, which will show information for whatever is the highest layer in the drawing order. If you query this scanned map dataset (select the Explore button in the Map section of the top ribbon, then select any pixel on the map – also known as the ‘Identify’ tool in other software such as QGIS), a single pixel flashes, and you get a pop-up that lists the colour values. No map attributes are attached, and you cannot change the symbols.

UTM Zones for BC
Note that in UTM, the coordinates come in 3 parts: X, Y, and Zone (or Zone first, followed by X and Y). X and Y are in metres and represent a distance from a point, but what is that point? This depends on what zone you are in. UTM divides the earth into 60 slices, each 6 degrees wide, and then is cut through the equator to divide these slices into North and South. As an example, BC falls within the 10th ‘slice’, and is in the Northern Hemisphere, giving UTM Zone 10N.
There is an interactive map available here that you can use to explore where these Zones exist https://mangomap.com/robertyoung/maps/69585/what-utm-zone-am-i-in-#
You may have noticed that ArcGIS Pro displays the UTM Zone for Prince George as 10U. The letter corresponds to the row of the global UTM grid that you can see here: https://www.dmap.co.uk/utmworld.htm
Map Measurements
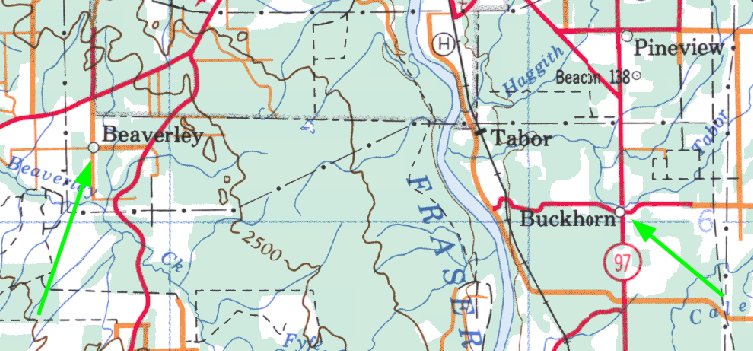
Just south of Prince George, on the NTS_093G map, you will find Beaverley and Buckhorn.
On the Map tab of the ribbon, you will find the measure tool.
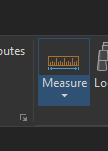
With this tool selected, you can click on two points and get the distance between them. By default the tool will measure in Planar mode. This is perfect for today’s uses, but as we start to work with larger areas, you may want to start using geodesic measurements to account for the curve of the earth. Next to the Mode drop-down, there is a drop-down to select what unit you would like to measure in.
Question 3a
a) What is the distance between Beaverley and Buckhorn? Report the value to the nearest km.
You can also measure areas by clicking the arrow below Measure and choosing Measure Area. With this, you can make a series of points, double click to finish the selection, and ArcGIS Pro will calculate the area bounded by the shape you make. Zoom into Ten Mile Lake near the southeast corner of the map and roughly measure the area of the lake.
Question 3b
b) What is the area of Ten Mile Lake in hectares?
Determining Map Sheet Names and Numbers
There is a Provincial park northwest of Prince George called Eskers. Using the BC 20K Grid layer we added earlier and the World Topographic base map, find Eskers and identify the TRIM tiles corresponding to the features below.
Question 4a
a) How many 1:20,000 map sheets are needed to cover Eskers Provincial Park?
Question 4b
b) Which 1:20,000 map sheet (using the NTS naming convention for BC TRIM sheets) includes Dragon Lake near the city of Quesnel (south of Prince George by ~111 km)?
PG Map
PG Map is a website that uses ESRI Geocortex, an application very similar to the portal for ArcGIS Pro we are using in this class (https://unbc.maps.arcgis.com/) but with a bigger emphasis on publishing data to the public as opposed to within your organization.
You can access PG Map here:
https://pgmap.princegeorge.ca/Html5Viewer/index.html?viewer=PGMap
In the web viewer, you will find many familiar tools and panels such as the table of contents on the side that shows all of the geospatial data that is publicly available from the City.
Spend a few minutes exploring the map, look at different layers and explore what the tools in the toolbar do.
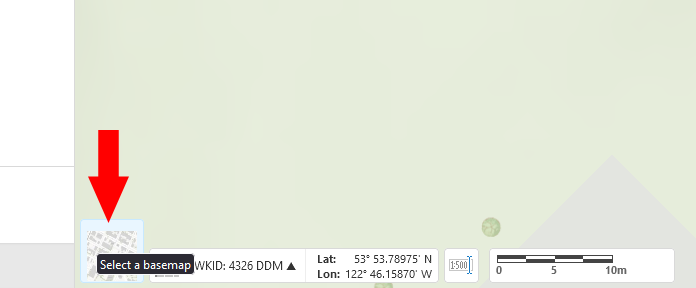
Now we will look specifically at the Coordinates widget
You will find it along the bottom of the map

You will see that you have various options for the format of the coordinates
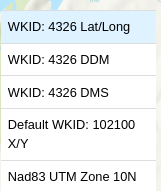
At this point we are familiar with a couple of these: UTM, and 4326 DMS (DMS stands for Degrees Minutes Seconds). The default in this list is Lat/Long where coordinates are expressed in DD or Decimal Degrees, but we also see DDM, Degrees with Decimal Minutes.
Which one of these coordinate systems you should use depends on what you are trying to communicate. When making maps, you should always try to avoid coordinate systems that include 4326, as this is the code for unprojected data, however DMS is still a great format for sharing point data, especially for people navigating with a compass. UTM is helpful since coordinates match to real world distances, but gets more and more unwieldy as maps begin to cover very large geographic areas. That said, at a city scale, UTM is a great choice.
You may have also noticed WKID: 102100 X/Y in the list. You should avoid sharing coordinates from this system to maintain conventions, but believe it or not, this may be the projection that you actually use the most on a day-to-day basis because this is the projection that is used by Google/Bing/Apple Maps. These apps nearly always convert to DMS or DD before providing coordinates to end users, which is why you may not be immediately familiar with 102100 X/Y as a coordinate system.
Question 5a
For questions 5a and 5b: give your answers without decimals of metres or seconds, as it is illogical to be so precise for features that are tens of metres in size.
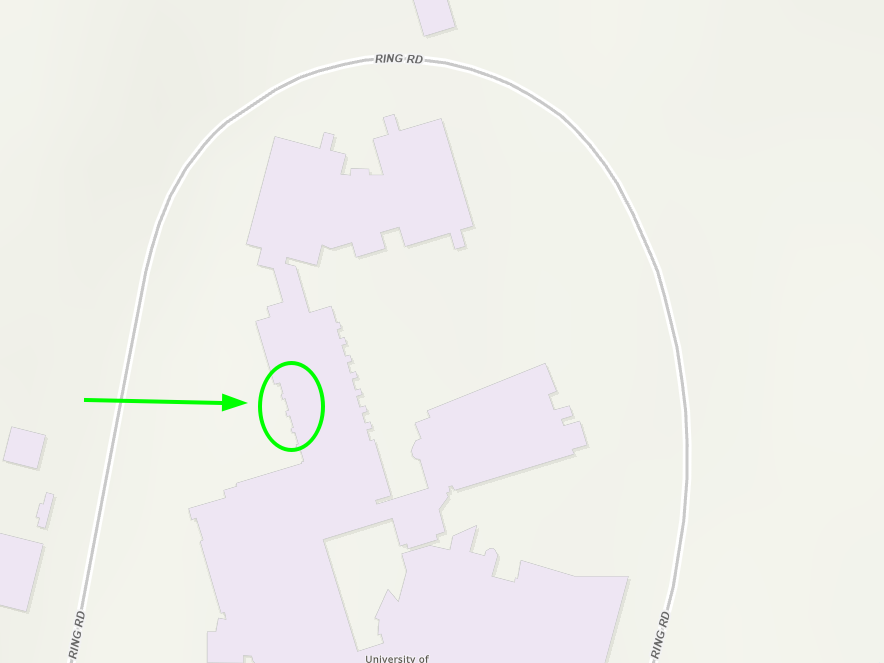
a) Using PG Map, what are the UTM coordinates of the GIS lab at UNBC? See the screenshot below to help you find the lab once you find the UNBC campus on the map.
Question 5b
b) What are the DMS coordinates of City Hall in Prince George? Use the search bar in the top right to help you find it if you’re not sure.
Question 5c
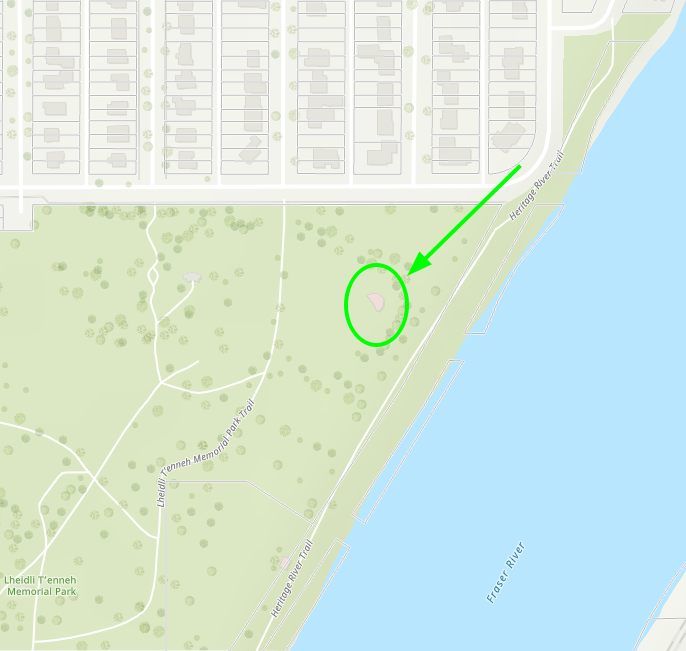
c) What are the Decimal Degree (DDM) coordinates of the bandshell in Lheidli T’enneh Memorial Park?Give your answer to two decimal places. See the screenshot below to help you find the bandshell once you find the park on the map.
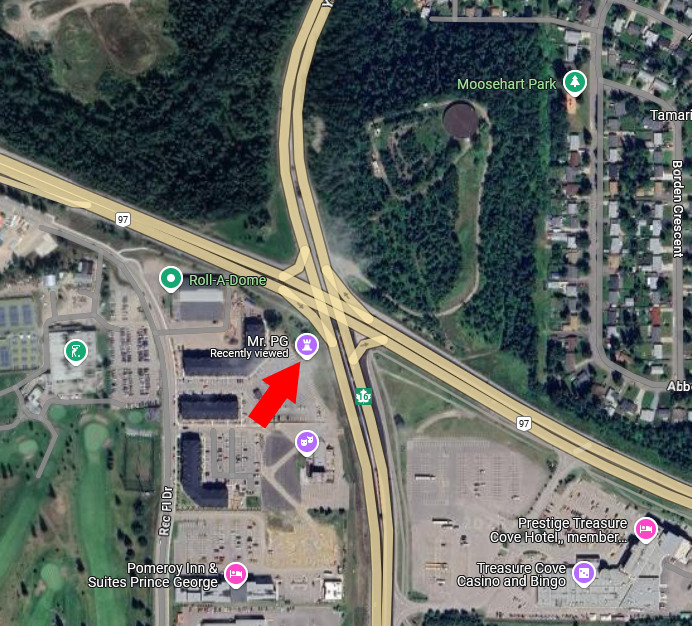
d) In PG Map, change your base map from ‘Basemap’ to ‘Orthophotos’. What are the Lat/Long (Decimal Degrees) coordinates of Mr. PG at the junction of Highway 16 and Highway 97? Hint: Look him up on Google Maps first if you’re not sure, or refer to the screenshot below. Once you’re in the right area, zoom in and look for his yellow hat and his shadow. Give your answer to three decimal places.
Submit your assignment as a word document in Moodle before the start of next weeks lab.
Extra: BC provincial iMap website map viewer: https://maps.gov.bc.ca/ess/hm/imap4m/
You will see some similarity to PGmap in how the BC map viewer is organized. The format is a bit annoying where half the screen is lost to menu options. Try the Coordinates widget here and you’ll see the addition of the BC Albers system. Click on “I want to …” and ‘add provincial layers’ to see the range of BC data layers are at your disposal. The imagery -> DataBC Orthophoto displays photomosaics for the whole province.